![]()
![]()
![]()
![]()
![]()
![]()
![]()
![]()
![]() Home > World Business
Home > World Business
Bull Or Bear, Four Gold Charts That Offer Something For Everyone
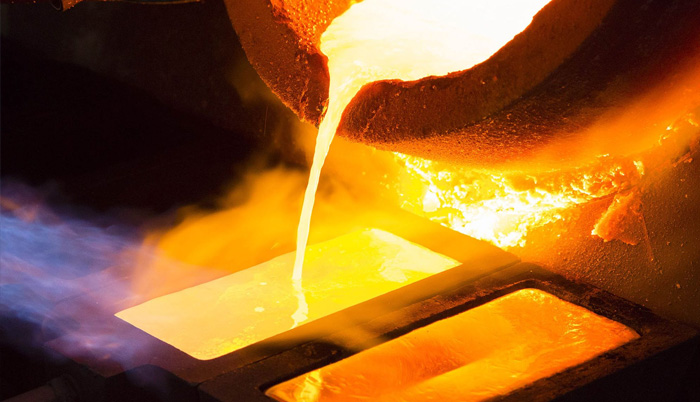
Photographer: Duncan Chard/Bloomberg
![]() June 23rd, 2017 | 08:45 AM |
June 23rd, 2017 | 08:45 AM | ![]() 1222 views
1222 views
BLOOMBERG.COM
Record-high equities, a hawkish Federal Reserve wary of a tight labor market and intent on more interest rate hikes, and a recovering global economy have helped to embolden the bears, while deep-seated worries over Donald Trump’s controversial presidency and heightened geopolitical risks invigorate the bulls.
Even after prices climbed about 9 percent this year, they’re only back to levels they were at roughly a year ago, before they embarked on a roller-coaster ride that lifted them as high as $1,375 and took them as low as $1,123 an ounce. Gold traded at about $1,252 on Thursday. The following charts may offer succor to bulls and bears alike.
The trend line dates back to the record of $1,921.17 in 2011. While prices burst through in early June, they failed to hold. Gold’s inability to sustain its rally after briefly breaking through its long-term bearish trend “is not a healthy sign,” said Fawad Razaqzada, a London-based analyst at brokerage Forex.com. Prices could drop to $1,236, and then to $1,200, he said, adding a decisive break above the line is needed to signal the end of the downtrend.
Gold is the most expensive relative to silver in more than a year. The metal is little changed in the second quarter while silver has lost 9 percent. Silver tends to fall more than gold when precious metals weaken, while the reverse happens in a bull market. The ratio of 75 is above the 10-year average of 62.5.
“It’s probably a good moment to buy silver and sell gold if you like to trade the ratio and believe there’ll be even a moderate amount of mean reversion,” said Philip Klapwijk, managing director of Precious Metals Insights Ltd. “That said, gold’s not that far above the 200-day moving average and a break below that could trigger a leg down, which would probably see the ratio blow out.”
There are also some bullish signs. Higher highs and higher lows signal a continuing rally for some technical analysts. Prices will stabilize between the 200-day moving average at $1,237 and $1,250 and then edge higher toward $1,300 later in the year, as the U.S. dollar comes under more downward pressure, according to Georgette Boele, a currency strategist at ABN Amro Bank NV in Amsterdam, on Wednesday.
Gold may be in a longer-term bullish trend signaled by the formation of a rare golden cross in December, according to Ned Naylor-Leyland, manager of the Old Mutual Gold & Silver Fund. That’s when the 50-week average moved above the 200-week gauge, and the previous time it happened was in 2002. When the opposite happens, it’s known as a death cross and considered bearish. Every time they’ve crossed in the past 30 years, it foreshadowed a broad price move that lasted at least three years in gold and real bond yields, according to Naylor-Leyland.
Source:
courtesy of BLOOMBERG
by Ranjeetha Pakiam
If you have any stories or news that you would like to share with the global online community, please feel free to share it with us by contacting us directly at [email protected]
Today |
5824 |
Since March 25, 2016
![]()
![]()
![]()
![]()
![]()
© Copyright 1999 - 2024 | Brunei's No. 1 News Website. All Rights Reserved.
1250-A, Jalan Tanjung Bunut,Jalan Tutong BF2920, Bandar Seri Begawan, Negara Brunei Darussalam